Xander Schulz · 15 September 2026
From Classroom to Canopy: How Ahornfeld Students Are Mapping Local Tree Networks to Track Seasonal Changes
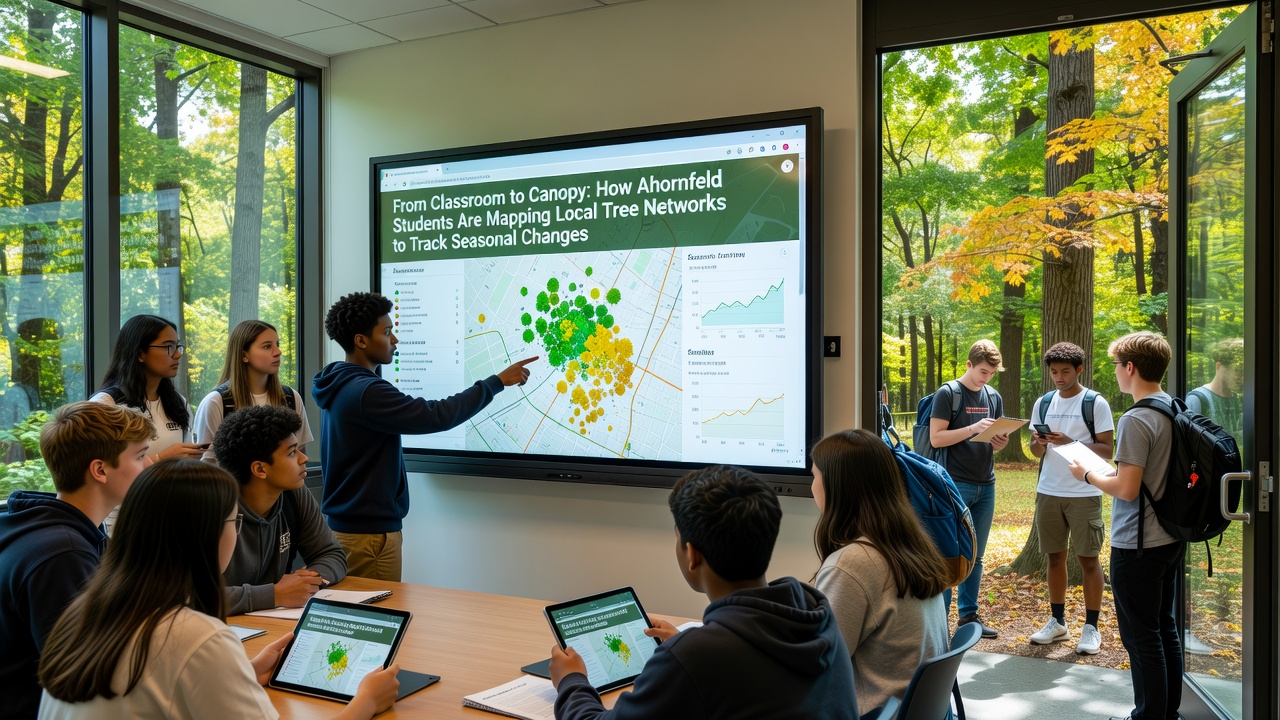
Students in Ahornfeld have developed a hands-on program that combines classroom lessons with field mapping of local tree networks, and the effort focuses on documenting seasonal shifts in maple adn mixed hardwood stands across the region. The initiative pairs geographic information systems with basic sensor technology so participants can record leaf emergence, color change, and canopy density at regular intervals throughout the year.
Project Origins and Structure
The program began when local educators collaborated with forestry technicians to create a repeatable protocol that secondary students could follow without specialized equipment beyond tablets and handheld GPS units. Each autumn cohort receives training in identifying tree species, measuring diameter at breast height, and noting signs of stress such as early leaf drop or fungal presence. Teams then divide mapped plots into grids and upload observations to a shared database that updates in near real time.
By September 2026 the project will mark its fourth full cycle, and coordinators plan to expand coverage to additional stands along the valley slopes where elevation gradients create noticeable differences in phenological timing. Data collected so far show that maples at lower elevations reach peak color roughly ten days earlier than those on north-facing slopes, a pattern consistent with temperature records from regional weather stations.
Methods Students Use in the Field
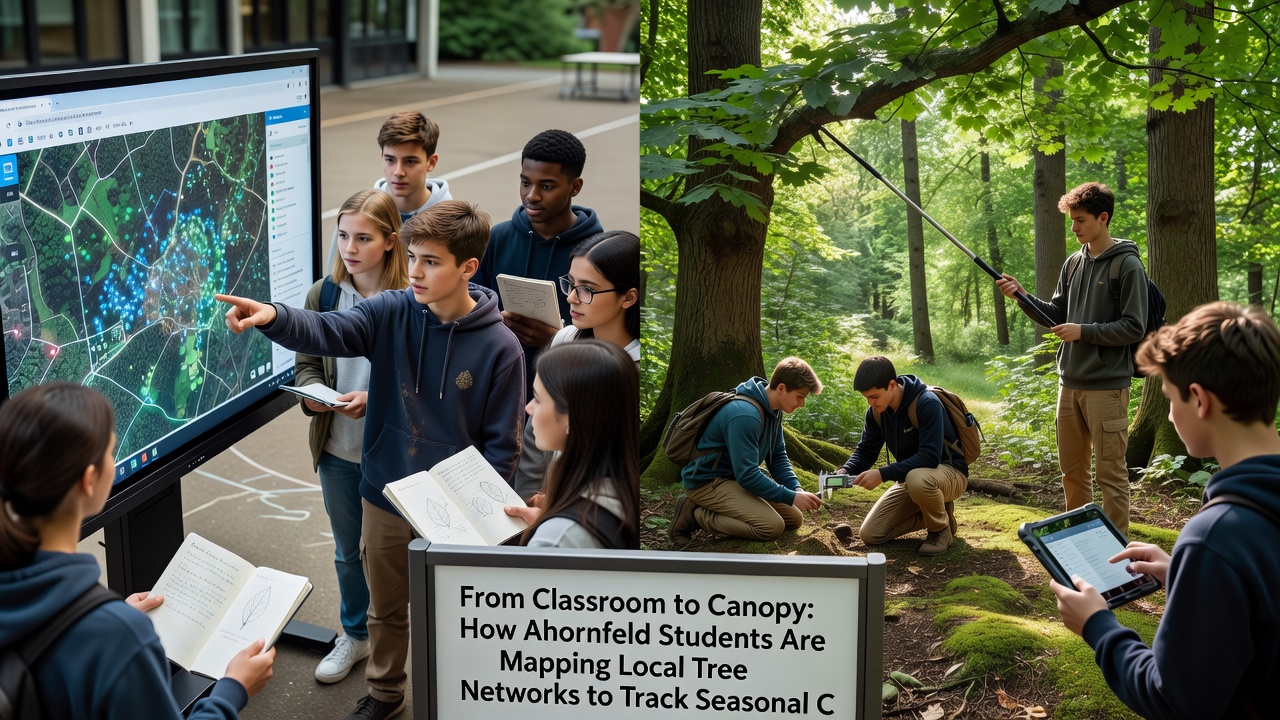
Participants carry lightweight multispectral sensors that capture reflectance values in visible and near-infrared bands, allowing simple calculation of vegetation indices without laboratory processing. They also install small temperature loggers at one-meter height on selected trunks, and these devices record hourly readings that later correlate with satellite imagery from public sources. When students return to school they compare their ground measurements against open datasets maintained by national forestry agencies, which helps them identify discrepancies caused by microclimate effects.
One team documented a cluster of mature maples whose root zones appeared connected through visible fungal mats on the forest floor, and follow-up visits confirmed that these trees retained leaves longer into the season than nearby individuals lacking similar fungal associations. Such observations align with broader studies on mycorrhizal networks that influence water uptake during dry spells.
Data Patterns and Regional Comparisons
Analysis of three years of student-collected records reveals that spring bud burst advanced by an average of 4.2 days between 2023 and 2025, while autumn senescence showed greater variability tied to precipitation totals in August. Students cross-reference their findings with reports from the Canadian Forest Service on boreal hardwood responses, and they note similar directional shifts even though Ahornfeld experiences milder winters. Another comparison links their observations to work published by Australian researchers tracking eucalypt phenology under variable rainfall, highlighting how different forest types register climate signals through canopy timing.
School administrators report that the mapping exercise integrates directly into biology, geography, and mathematics curricula, so students practice statistical tests on their own datasets rather than relying on textbook examples. Teachers adjust lesson plans each term based on the previous season’s anomalies, such as the unusually prolonged green canopy observed in 2025 after heavy July rains.
Community and Scientific Connections
Local forest managers receive summarized reports from the student database each quarter, and they use the information to prioritize areas for selective thinning where dense understory appears to delay maple regeneration. The shared platform also allows residents to submit supplementary photos of notable trees, creating a growing archive that spans both public and private land parcels. In turn, visiting scientists from nearby universities occasionally request access to raw sensor files for modeling exercises that compare ground data against satellite-derived greenness indices.
Equipment costs remain modest because the program reuses devices donated by a regional technology firm and relies on open-source mapping software maintained by an international consortium of educational institutions. Students learn basic data validation routines, including checks for GPS drift and sensor calibration, before any new observations enter the permanent record.
Conclusion
The Ahornfeld student mapping effort continues to generate consistent seasonal datasets while giving participants direct experience with ecological monitoring techniques. As the September 2026 cycle approaches, coordinators expect further refinements in sensor placement and additional cross-checks against continental-scale phenology networks. The resulting records contribute to a clearer picture of how local tree networks respond to shifting temperature and moisture patterns across multiple growing seasons.