Jordan Carter · 27 October 2026
Seasonal Patterns Unfold Across Ahornfeld as Educational Initiatives Connect Tree Data with Conservation Planning and Agricultural Adaptations
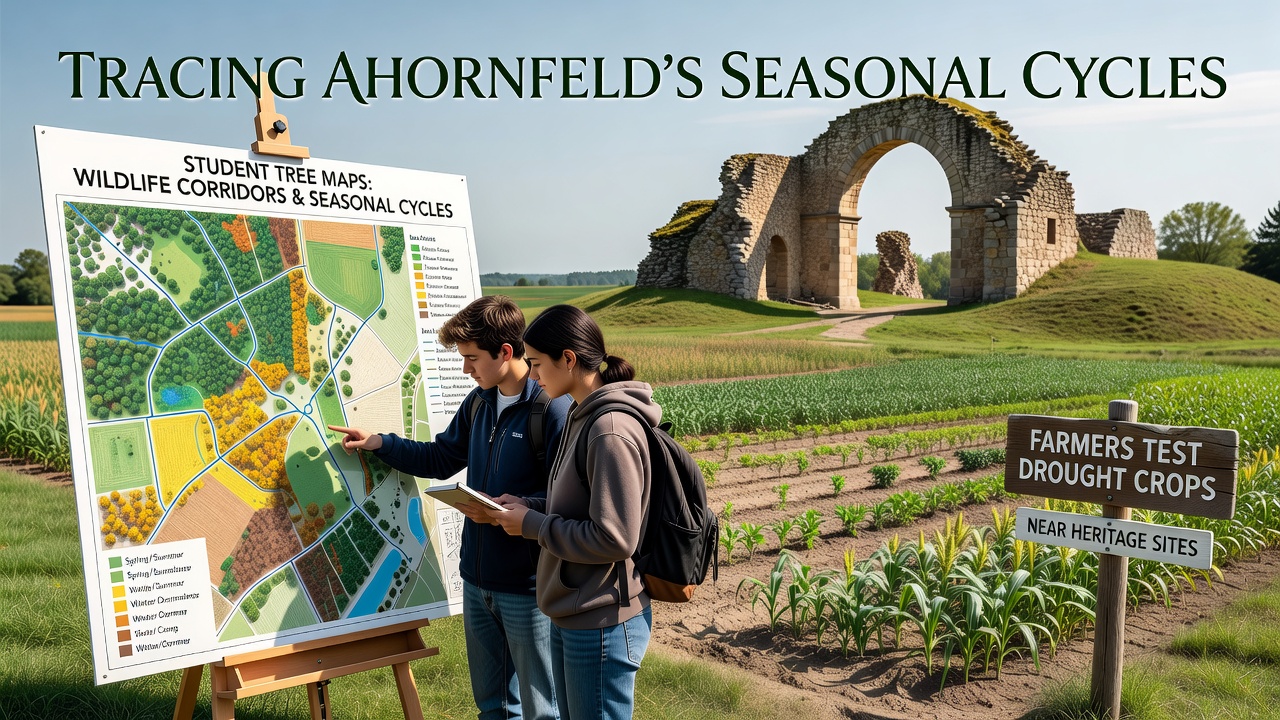
Ahornfeld sits in a region where October 2026 brings measurable shifts in leaf color, soil moisture levels, and animal movement patterns that local monitoring programs have tracked for several seasons. Students from regional schools collect tree location data using standardized GPS protocols, and this information feeds directly into corridor planning efforts designed to maintain connectivity between forested patches and open meadows. Researchers note that these maps highlight routes where deer and smaller mammals travel during cooler months when food sources change, while the same datasets help identify areas where canopy cover influences ground temperature and water retention.
Student Mapping Programs Track Phenological Changes
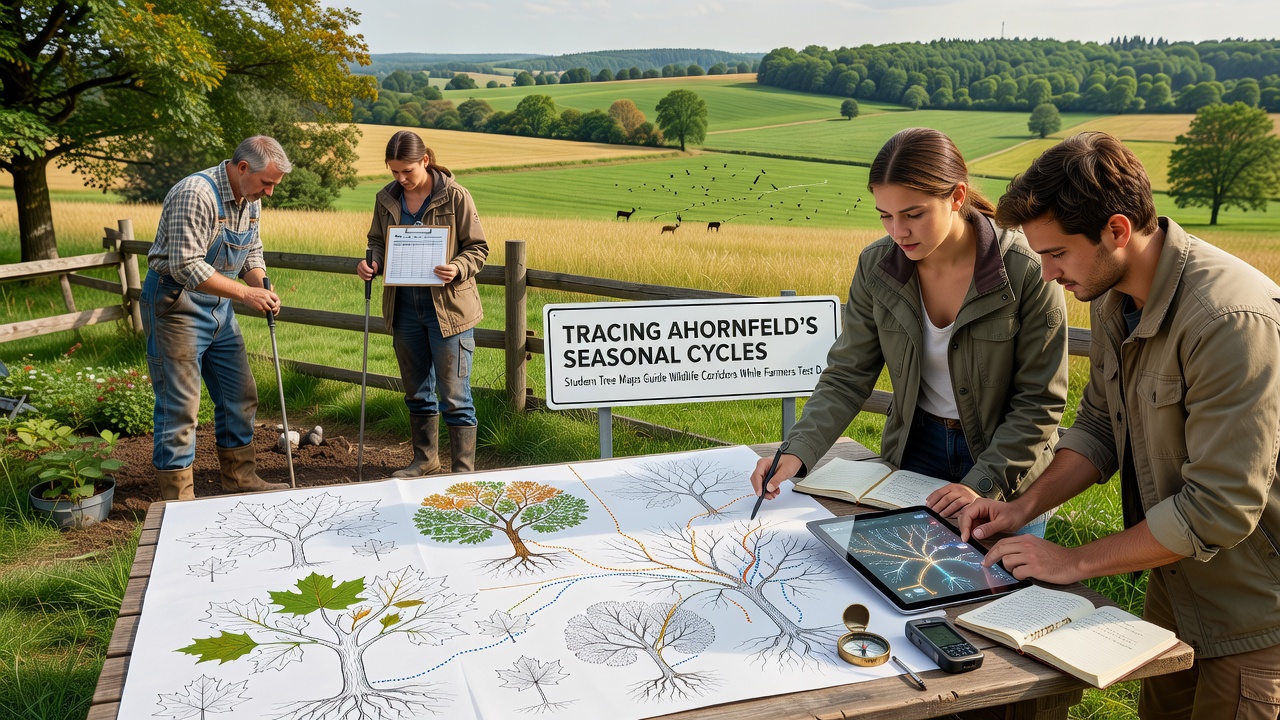
Classes divide sections of woodland into grids and record species composition, trunk diameter, and canopy density at regular intervals throughout the year. In October 2026 the data sets show earlier leaf drop in certain maple stands compared with records from five years prior, and this observation aligns with temperature averages reported by national meteorological services. The resulting maps overlay wildlife trail data collected through camera traps, and planners use the combined layers to adjust corridor widths so that movement remains uninterrupted by new fencing or path construction. One study from the European Environment Agency provides benchmarks for corridor dimensions that several regional projects have adopted, and Ahornfeld teams compare their findings against those guidelines each season.
Farmers Conduct Drought Crop Trials Near Protected Locations
Fields adjacent to historic farmsteads and stone boundary markers now host test plots of drought-tolerant barley and clover varieties selected for shorter growing cycles and deeper root systems. Soil sensors placed at multiple depths record moisture retention rates, and October 2026 readings indicate that certain hybrid strains maintain higher water content during extended dry periods than traditional local cultivars. Agricultural extension officers collect yield samples from these plots and compare them with control areas located farther from heritage boundaries, ensuring that experimental activity does not disturb protected structures. Equipment used for planting and monitoring follows established buffer distances that preserve both archaeological integrity and visual character of the sites.
Integration of Seasonal Data Across Sectors
Tree mapping outputs and crop trial results share a common geographic information system that updates monthly, allowing corridor designers to account for changing vegetation density while farmers adjust irrigation schedules based on canopy shade measurements. In October 2026 the combined records reveal that corridors passing through areas with denser maple cover retain higher humidity levels, which in turn supports ground-nesting species that farmers observe near their test fields. Data sharing occurs through quarterly meetings where representatives from education programs, agricultural cooperatives, and heritage preservation groups review the same layered maps and adjust priorities accordingly. Figures released by the Australian Bureau of Agricultural and Resource Economics on drought adaptation in similar temperate zones serve as reference points for yield projections, and local teams note parallels in soil type responses.
Additional layers include records of bird migration timing and insect activity peaks that students gather during field sessions. These observations help refine corridor placement so that flowering periods in understory plants coincide with pollinator movements documented in adjacent meadows. Heritage site managers contribute constraints on equipment access and noise levels during planting windows, which farmers incorporate into their seasonal calendars without altering trial protocols.
Conclusion
Records compiled through October 2026 demonstrate that student-generated tree maps supply spatial information used for wildlife corridor adjustments, while drought crop experiments proceed under defined distance rules from heritage features. The shared data platform connects phenological observations with agricultural measurements, and participating groups continue to align their activities around the same seasonal datasets.